ESnet’s EinR Summer Interns Are Visualizing Their Path to a STEM Career
By Bonnie Powell
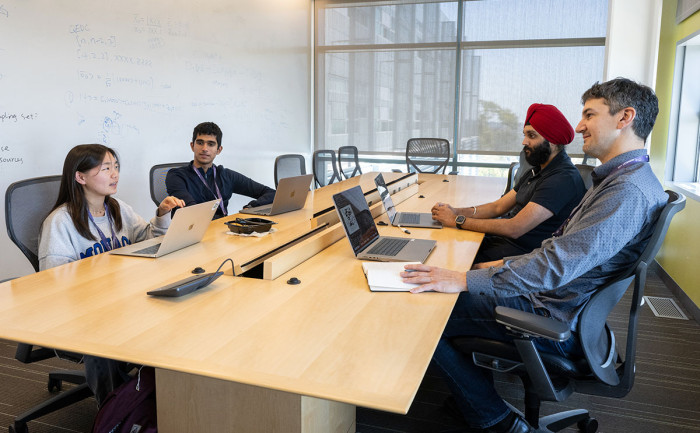
EinR interns Ella Jeon and Sahil Nayak meet with ESnet mentors Sartaj Baveja and Chris Tracy (left to right)
Research has documented what commonsense has long indicated: offering internships is a highly successful way of increasing the number of college graduates interested in pursuing careers in science, technology, engineering, and math (STEM) related fields. But while STEM-focused college internships are widely available, high school programs are less so, and paid high school programs remain rare. The Experiences in Research (EinR) six-week program offered by Berkeley Lab’s K-12 STEM Education and Outreach division, which has served 147 high school students since launching in 2021, plays a key role in the Lab’s efforts to build a robust STEM pipeline.
This year saw a record-breaking number of applicants. Among the summer’s cohort of 53 high school EinR interns are three from Hawai'i and two from the Bay Area who are working on similar but different network data visualization projects for the Energy Science Network (ESnet). The EinR program has historically prioritized Bay Area students in order to offer a hybrid experience, but EinR Lead Mentor Katrina Turner, a software engineer in ESnet’s Measurement & Analysis group, petitioned for and received a geographic exception.
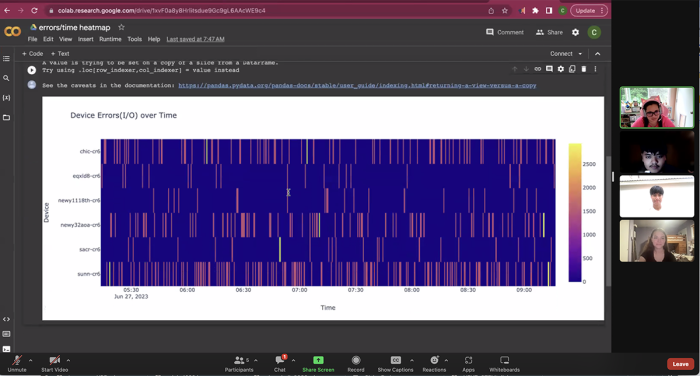
ESnet Lead Mentor Katrina Turner meets with EinR interns Ralph Uy, Zhane Bell, and Claire Sorges (from top to bottom) to discuss their heatmap and other data visualizations. (Click to enlarge.)
“Hawai'i kids don’t have these kinds of opportunities often — certainly not paid. They usually have to choose between internships and summer jobs,” said Katrina, a former high school math teacher and Hawai'i resident who lives on Oahu. “It is so important to give them such opportunities young. There is a huge difference between taking a coding class in high school and actually seeing yourself as a software engineer.”
Another difference between a high school programming class and an EinR internship: the projects are intended to be much more open-ended, in order to encourage exploration and a sense of ownership.
The Hawai'i group was tasked with creating proof of concepts for possible new types of network data visualizations that could be helpful to network engineers and users at ESnet. For Zhane Bell, a rising junior from Ewa Beach, Hawai'i, that was also one of the biggest challenges. “We’re more used to the system used in school, where you have to write code to accomplish a specific task. This internship explores more of the creative side of coding: we were given a bunch of data and told to just experiment and build graphs we think will be useful,” he recounted. “It was fun seeing what new things we would be able to create.”
According to Turner, the Hawai'i group sparked a lot of ideas for new visualizations, including heat maps, “which we don’t actually currently have on Stardust but are going to add. And Claire [intern Claire Sorge] found a hive plot – a different way of showing network graphs – that I had never seen before!”
Snapshot of the process the Hawai’i team went through to get network data into a network graph and then finally, a hive plot..
Bell, Sorge, and Ralph Uy are exploring whether the hive plot could be a useful tool for ESnet’s internal- and external-facing portals. “The hive plot has proved challenging for all of us,” said Sorge. “We have to change the data to fit the library and then use the library to plot the graph, but we keep running into errors. It's fun to fix errors and change the code to make it work.”
The two Bay Area interns, Sahil Nayak and Ella Jeon, are working with Planning & Architecture Acting Group Lead Chris Tracy and Measurement & Analysis Software Engineer Sartaj Baveja (who is also mentoring the Hawai'i trio) on a project involving new methods of visualization for network flow data, but with a focus on exploring the tools used to generate the visualizations: Grafana plugins, Javascript programs, GIFs generated via code, or something else.
An animated simulation of network data created by Nayak and Jeon.
“Much of the things I am doing in the project were things I could not have imagined were in my ability to try a month ago,” said Jeon. “One significant new mindset I have experienced over the course of this internship is the whole ‘being able to try things that I didn't think were really possible or something I was really capable of’ type of realization. The boost of guidance and support in this internship has made me realize how much more I could go on to try and achieve on my own as well.”
That’s exactly what EinR mentors are hoping for. “I chose to volunteer for this program because I deeply believe in empowering young individuals and giving them opportunities to explore their full potential,” explained Baveja. “This group’s contributions and fresh perspectives have brought new insights to our work. They remind me of the importance of investing in the next generation of scientists and engineers. Mentoring them has been mutually enriching, and I'm confident they will make a positive impact in their academic and professional journeys.”
ESnet's and other EinR participants will give oral presentations on their work during the Summer Student Graduation and Symposium on Friday, July 28, which will also showcase the work of students in the Berkeley Lab Director’s Apprenticeship Program.
 “This summer I learned how to read the documentation of certain coding libraries. This is a skill I never really had the chance to develop before the internship. I learned how to skim through long texts, and go through the key points in order to make my code work. This internship has just reminded me of the fact that there really are multiple solutions to coding problems. It is not like other subjects where there is only one correct answer. I was told this before by my computer science teachers at school, but I got to experience it through this internship as I saw the different approaches me and my fellow interns took at accomplishing the same tasks.”
—Zhane Bell, rising junior in Ewa Beach, HI
 “While I was self-studying machine learning, data science was something that came up frequently and felt like something essential and foundational yet was something I knew incredibly little about. Finding this project on the list in Berkeley Lab’s EinR program immediately caught my attention. The most challenging part of data visualization lies in the alterations we must perform in order to make the visualizations more presentable, readable, and visually appealing to the viewer. This is also the fun part of the experience, because we, as a group, get to have intriguing discussions and discover new methods we hadn't known about before. I think the best part of this experience though has been being able to bring to life the images and ideas I have in my head to the real screen.”
—Ella Jeon, rising junior in Pleasanton, CA
 “My favorite part of the program is learning more about python visualization code. I have had limited experience in creating data visualizations in the past, and I am less comfortable using python compared to other coding languages, so having to get more familiar with python and its visualization libraries was challenging yet enjoyable for me.”
—Sahil Nayak, rising junior in San Ramon, California
 “I'm interested in data analysis as a career path, as I love looking over real world data and using my coding skills to make the results more accessible to others. What I like about ESnet's project is that I get to work with real-world network data and in the process learn more about networks and graphs and how to read new visualizations, like heat maps and hive plots. ”
—Claire Sorge, James B. Castle High School ‘23, heading to University of Hawaiʻi at Mānoa
 “I was drawn by the opportunity of learning a new branch of computer science. I'm not familiar with network data visualization as a whole; however, I've had experience working with networking by itself through my experience with cybersecurity. So far, I've learned that there's always some sort of pattern within a system as long as you plot the corresponding variables together. It's really fun to clean data and watch the graphs fill themselves in automatically.”
—Ralph Uy, James B. Castle High School '23, heading to University of Hawaiʻi at Mānoa