Introducing TerraNova: A Customizable, Open-Source Solution for Network Mapping
ESnet’s new software helps users create the network maps they need, in the format they need, when they need them
By Sara Harmon, media@es.net
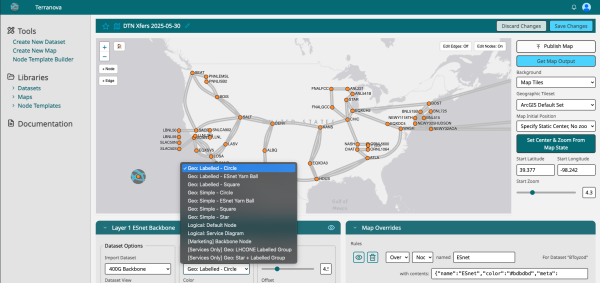
ESnet's TerraNova User Interface. (Data contained in this image is either public or has been anonymized.)
Key Takeaways:
- ESnet, DOE’s high-performance networking user facility, has released TerraNova, an open-source software designed to transform a set of network parameters into a visual representation of the network’s topology (how the pieces of the network are laid out)
- TerraNova provides highly customizable mapping outputs in a variety of geographical or logical formats
- TerraNova users will be able to automate a long-standing problem in data network mapping: keeping maps accurate amidst very frequent changes
Mapmaking has been around for millennia, for as long as humans have needed to record the physical features of a defined region. Traditionally, maps have been painstakingly hand-drawn. While modern tools such as design software, satellite imaging, and geographic information systems (GIS) have made the process of mapping less time-intensive, most maps still involve significant human effort to create and update.
However, because a map is a single snapshot in time, as soon as it is made, it begins to become outdated. This is particularly true for data networks, in which changes occur quite quickly — say, if a node (the access points that connect a network) is upgraded or removed, which, in turn, can affect performance and service availability. Energy Sciences Network (ESnet) software engineers in the Measurement & Analysis (M&A) group have developed a solution to this common yet critical complication of maintaining a research data network: TerraNova, a highly adaptable, open-source software for network mapping and visualization that was released on April 1, 2026 via Github. The TerraNova editor can be used for both high-level and highly detailed network cartography, improving situational awareness for engineers and network stakeholders by ensuring everyone has access to network schematics with the appropriate level of detail for their needs.
From Plug-In to Platform
ESnet is the U.S. Department of Energy (DOE)’s sole high-performance networking user facility, serving as the “data circulatory system” for tens of thousands of scientific researchers at all 17 national laboratories, 28 user facilities, and other scientific instruments in the U.S. and Europe, and peering with more than 270 research and education (R&E) and commercial networks. TerraNova was originally conceived as an internal tool, but it quickly became apparent that any network operations support team would benefit from having a real-time eye on network health and topology, in a variety of customizable formats.
One of the first milestones of the project was to develop a Grafana plug-in for the open-source, interactive data-visualization software Grafana, which is also used to display the maps in TerraNova. The plug-in was first deployed to provide the mapping for my.es.net, which offers a custom, public visualization of current ESnet network traffic (and up to 180 days of historical data). The team released the map renderer plug-in to Grafana users in December 2024; it has already been downloaded globally more than 10,000 times, demonstrating the need for a mapping tool that can visualize a network either geographically or logically in a variety of formats.
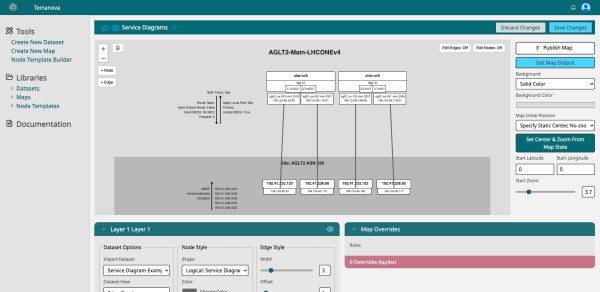
ESnet network engineers produce site service diagrams such as this one to depict how routers managed by different organizations exchange information. (Data contained in this image is either public or has been anonymized.)
With the new TerraNova release, network engineers will have even more tools to provide a consistently accurate and up-to-date view of their network and which nodes and connections are active when making critical service decisions.
“In ESnet’s case, every week we see new nodes and network paths being added to the network and some occasionally retired. And every six to seven years, our network undergoes a major upgrade, so any maps will also require a full refresh,” explains James Kafader, a computer systems engineer on ESnet’s M&A team and TerraNova’s lead software developer. “We have to represent this in a way that people can understand at a glance, while also providing different versions for different audiences with different networks. TerraNova has made this process more effective and efficient for ESnet, and we hope others will adapt it for their own workflows.”
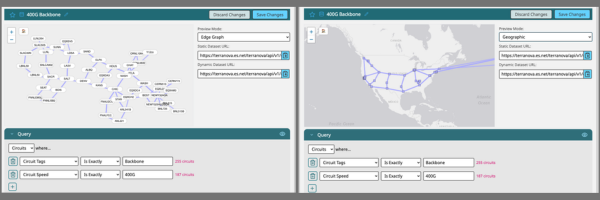
An example of the same data being displayed in different TerraNova outputs: (left) Edge Graph mode and (right) Geographic mode. (Data contained in this image is either public or has been anonymized.)
Saving Time, Reducing Errors
Terranova’s portal offers a variety of features allowing users to produce a map in the format that works best for them:
- Customizable maps, automatically generated from existing data sources such as the bundled Google Sheets plug-in or a custom Python adapter for the organization’s institutional network database;
- The ability to create maintainable network traffic maps tailored to specific use cases, in combination with the software’s map definition outputs (wireframes) and the Grafana plug-in, so that networks can visualize real time and the historical operational state;
- Service maps generated in multiple geographical and logical layouts;
- An interface that is easy for network engineers to maintain and update;
- Multiple file formats for exported maps, including SVG, Grafana, and embed code;
- Different map views and previous versions can be named and automatically saved for historical archives.
Different Maps for Different Audiences for Different Needs
ESnet carries virtually every project’s data that moves to or from a national laboratory site or DOE user facility, with approximately 30,000 organizations annually accessing the network. ESnet interacts directly with many major users and provides co-design or technical support to ensure the network meets the needs of their evolving research. Many of these projects involve transferring extremely large spikes of data from one place to another, usually at very high speeds and/or on a very short timeline.
Scientific researchers require a network with the most robust, reliable data-transfer capabilities, superior to what commercial providers offer even the most demanding business customer. A plasma fusion experiment whose data needs to be processed in real time at a supercomputer across the country, for example, has zero tolerance for buffering or latency. TerraNova is a tool that network engineers can use to allow all collaborators to see what's happening on the network and plan for how it can best support a specific project. This ‘co-design’ process is iterative, as is dialing in the TerraNova schematic. Having this software allows network engineers to create a rough draft, show it to stakeholders, and refine it based on feedback, then publish it and reuse it in multiple places, with consistent representation across multiple websites and tools.
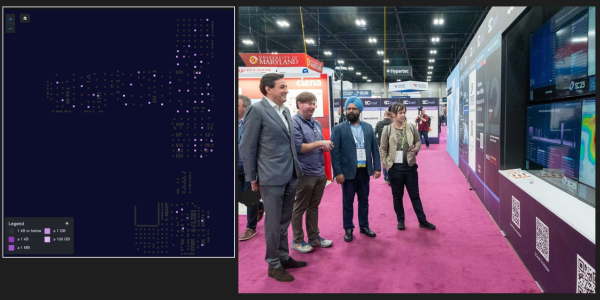
Left photo: A map of the showroom floor, made with TerraNova, demonstrating which booths were using the most SCinet bandwidth during the 2025 Supercomputing Conference (SC25). Right photo: DOE Under Secretary for Science Dario Gil views the SCinet data with ESnet engineer Jason Zurawski, Executive Director Inder Monga, and DOE Associate Principal Deputy Under Secretary Kristen Ellis. (Photo credit: ESnet)
This is especially important for projects with hundreds or thousands of collaborators from across the globe that utilize multiple networks to achieve their data transfer, such as the Vera C. Rubin Observatory’s Legacy Survey of Space and Time(LSST) and the multiple experiments associated with CERN’s Large Hadron Collider (LHC), both of which ESnet supports.
“I was looking for a map that could demonstrate the interconnectedness of all the institutions on a specific project,” explains Kate Robinson, an ESnet network engineer and LHC site ambassador. “I use TerraNova to show where there is overlap among the different institutions transferring LHC data, so we can see where we might experience bandwidth contention and be able to proactively address it.”
TerraNova can also enhance and streamline a variety of organizational processes. ESnet teams are in frequent contact with network users, and present formal network updates several times a year. Prior to TerraNova, they spent an hour or more manually updating their own map image file to include in the presentation. Not only does TerraNova reduce that task to about a minute, it also ensures that maps being presented are in the same format, making it much easier to compare and contrast changes.
When network maps require a lot of effort to produce, obsolete versions tend to linger and get shared from across and among organizations, with few realizing they are no longer accurate. Now any presentation, website, or customer portal can feature an accurate network map created that day: embedded TerraNova maps can be set to refresh automatically. And the same data can be output in multiple formats, for different purposes and audiences.
“Visualizing a network has always been hard, but doing it well provides a lot of benefits, especially in building understanding and facilitating conversations across communities that are not familiar with how a network works,” summarizes ESnet Executive Director Inder Monga. “We are pleased to offer this open-source tool to the data networking community, and in particular the national R&E networking community. We hope our colleagues find that TerraNova can serve as a single, trusted map resource that can be referenced, maintained, and updated automatically and thus help all of our networks serve science as seamlessly as possible.”